Page 58 - FiM_03_2016
P. 58
Tesi di Specialità
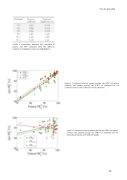
Tabella 2 Correlation between PR% obtained in patient and PR% obtained with the different dosimeters. Significant values are highlighted.
Figura 4 Correlation between gamma passing rate (PR%) in patient geometry and gamma passing rate (PR%) of simulated QA for cylindrical surface and cylindrical volume phantoms.
Figura 5 Correlation between gamma passing rate (PR%) in patient geometry and gamma passing rate (PR%) of simulated QA for planar phantoms placed at different depths.
50