Page 56 - FiM_03_2016
P. 56
The delivery error evaluated form dynalog files were introduced into clinical plan so to simulate the dose really deposited on patient during the treatment delivery and on phantoms during QA procedures. Different phantom geometry was considered: three planar geometry simulating GAFchromic measurements at different depths; a cylindrical surface geometry mimicking the measurements performed with cylindrical array of diodes; fully volumetric cylindrical measurements which simulates gel dosimetry. For each considered plan gamma analysis was performed comparing the planned dose distribution with the one artificially delivered. The values of the gamma passing rates obtained in each of the considered phantoms have been compared to that obtained in patient.
RESULTS
Accuracy of linac delivery
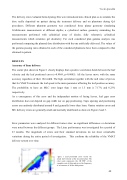
The scatter plot shown in Figure 1 clearly displays that a positive correlation holds between the leaf velocity and the leaf positional error (r=0.9969, p<0.0005). All the leaves move with the same accuracy regardless of their 184 width. The high correlation together with the null value of proves that for VMAT treatments the leaf speed is the main parameter affecting the leaf position accuracy. The probability to have an MLC error larger than 1 mm or 1.5 mm is 7.17% and 0.23% respectively.
As a consequence of this error and the independent motion of facing leaves, leaf gaps error distribution does not depend on gap width nor on gap positioning. Gaps opening and positioning errors are randomly distributed around 0 and generally lower than 1mm. Gantry rotation errors and MU delivery errors are generally small and normally distributed as shows in Figure 2 and 3.
Error parameters were analyzed for different tumor sites: no significant differences or deviations were noted between the different groups. The Linac performance was investigated for a period of 23 months. The magnitude of errors and their standard deviations do not show remarkable variations during the entire period of investigation. This confirms the reliability of the VMAT delivery system over time.
Figura 1 P
Tesi di Specialità
Figure 1 Leaf positional error versus the actual leaf velocity at the isocenter plan. The color scale represents the 2D PDF of the complete sets of data and gives the frequency of occurrence of all the data points.
48